System Diagrams
The following diagram may be useful, principally to people modifying and extending Spothole, to understand how the architecture of the system works. This first diagram covers the "read only" part of Spothole. It shows how spots and other data are retrieved from the various sources by the provider classes and cached in the data store, how they are then enriched with activity & callsign lookup data, and delivered to users & third-party clients via the web server.
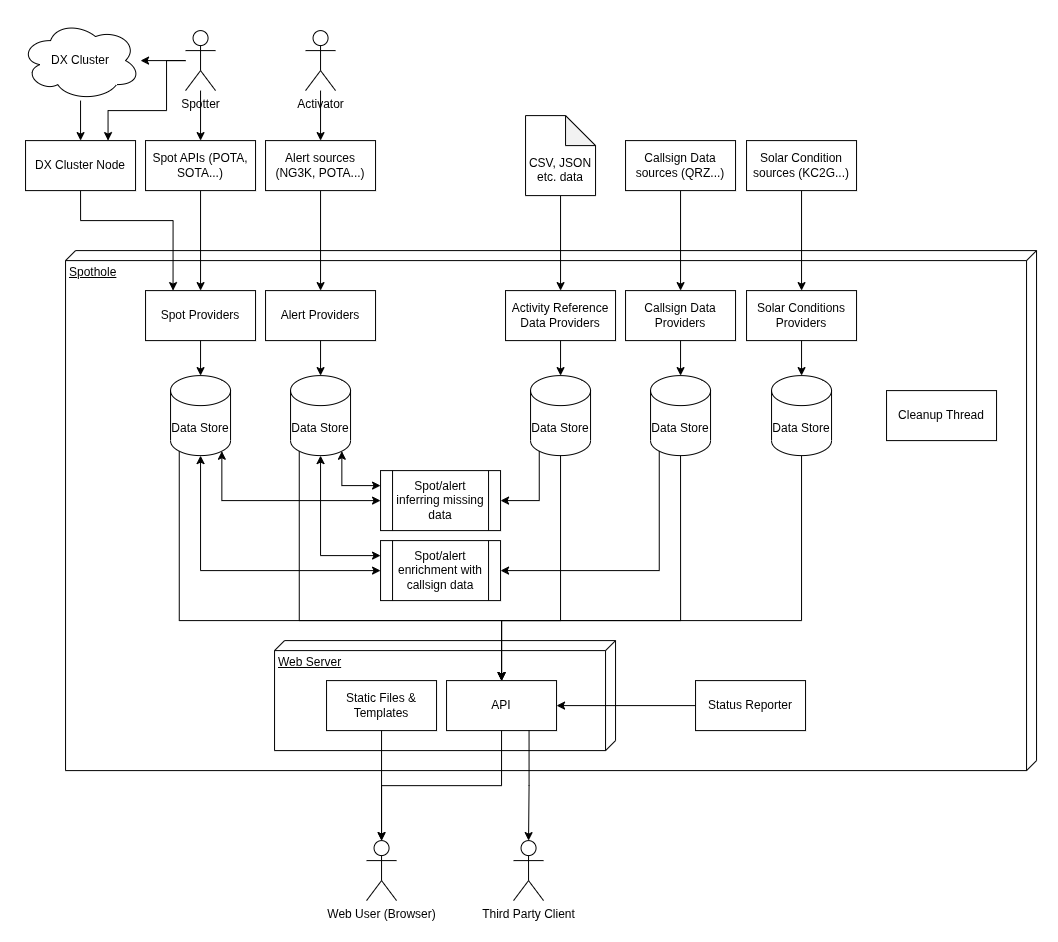
It is also worth pointing out that the above diagram doesn't show spots from other providers going on a loop back to the cluster. This is a relatively new feature of Spothole, where (optionally) the Cluster spot provider looks at the data store for new spots from a source like SOTA or POTA, and automatically sends those up to the cluster node (but not onward to the rest of the cluster). This doesn't touch Spothole's own API or web interface, so it's kind of a bonus feature on the side rather than Spothole's indended core functionality, but the option is there.
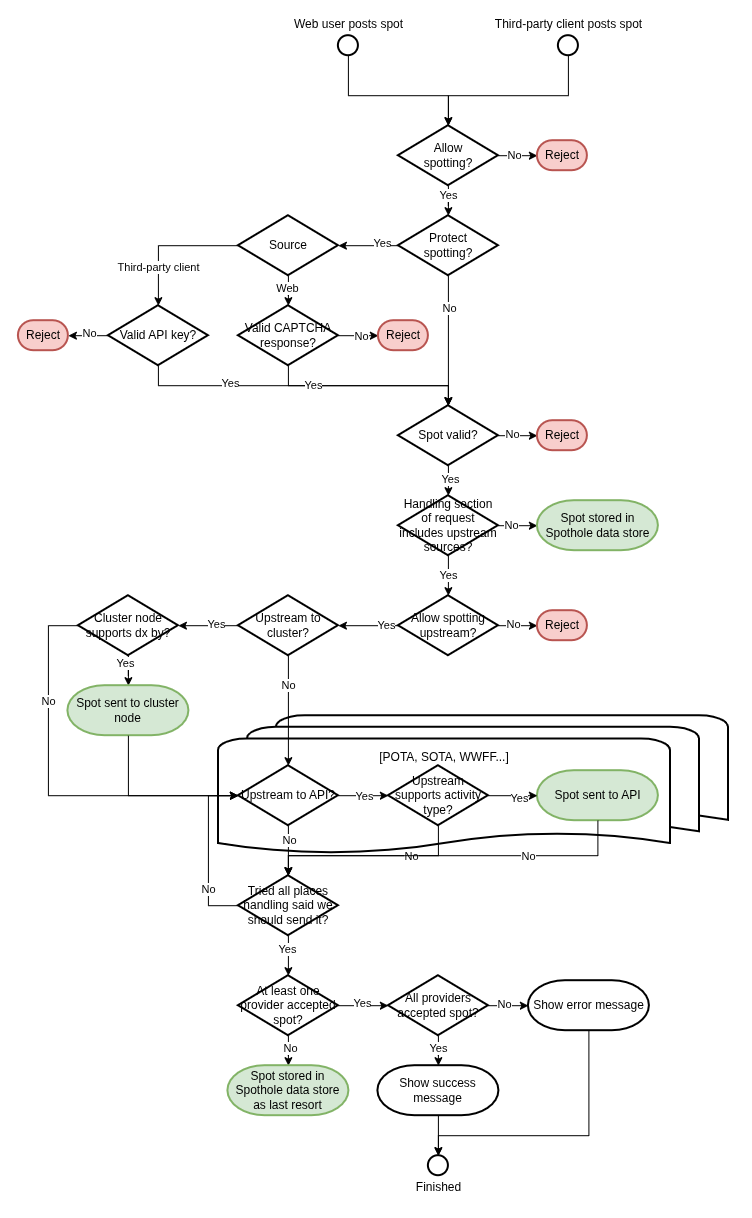
There is also the ability for web users or third-party clients to post spots to Spothole via its API, and for those to be sent upstream to the Cluster or various other providers. This really does post to the cluster node in a way that syncs to the rest of the cluster, and spots can also be sent to activity-specific APIs such as POTA's, if the "activity" of the posted spot is one that that API can accept. Posting spots back into the Spothole system adds an extra level of complexity, shown in the flow diagram below. Checks exist at all points in the process to ensure that the user has permission and the spot is going to the right place.